Kenya import Statistics

Kenya Import Data

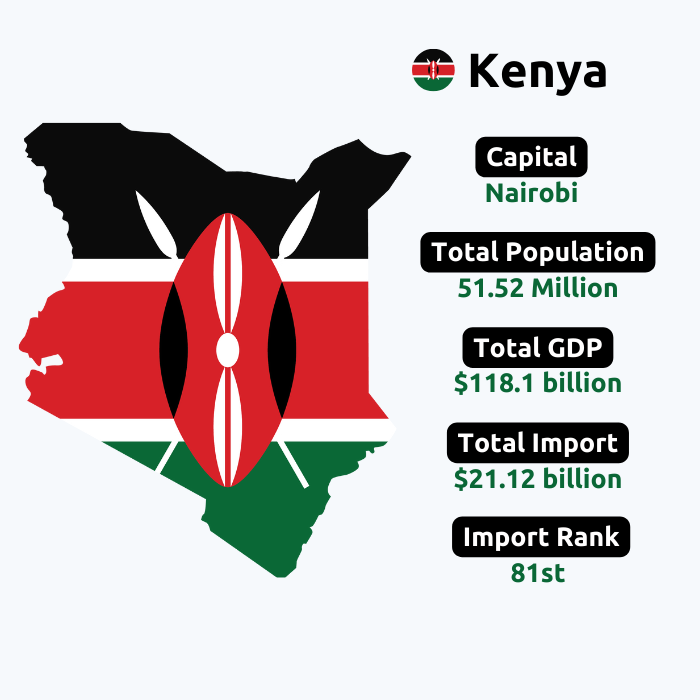
Kenya is a nation in Eastern Africa, sometimes referred to as the Republic of Kenya. Kenya is the 3rd largest economy in Sub-Saharan Africa followed by Nigeria and South Africa. Its boundaries are shared by several nations, including Tanzania, Sudan, Ethiopia, and Somalia. Nearly 62% of the GDP is derived from finance and telecoms businesses. According to Kenya import data, which was provided by Kenya trade data, Kenya ranked 83rd out of 226 nations in terms of total imports. In today's interconnected global economy, accurate and reliable import data plays a crucial role in shaping business strategies and decision-making processes. As an emerging market, Kenya has seen a significant increase in its import activities over the years.

According to Kenya's import data, Kenya imported goods worth a total of $18.6 billion in 2023. Kenya's imports of goods declined by 11% in 2023 as compared to the previous year. Kenya’s total GDP is $472.69 billion with a GDP import share of 19.92%. Mineral fuels and oils are Kenya’s biggest imports, while China is the biggest import partner of Kenya. Kenya is a part of trading blocs such as WTO and EAC. Let us now delve into the key insights, trends, and blooming import market with Kenya's import data, focusing on the year 2023.

 Kenya Import Data | Kenya Customs Data | Kenya Trade Data

83

The country has been ranked 83rd in global imports, showing a significant position in the international trade landscape and import market.

0.1%

With a mere 0.1% share in global import trade, it becomes evident that its presence in the international import market is fairly on the rise.

CHINA

China holds a significant role as the largest import partner of the country in terms of goods imports and import share.

MINERAL FUELS AND OILS

Mineral fuels and oils are the biggest import commodities of the country, playing a vital role in its economy.

Please select a country or provide either a description or HS Code.
import

Top 10 Imports of Kenya

Kenya, a vibrant economy in East Africa, relies on a diverse range of imports to support its growth and development. The top 10 imports of Kenya include a mix of essential goods and raw materials, ranging from machinery and vehicles to petroleum products and industrial equipment. The top 10 imports of Kenya in 2023, according to its import data are:

  • Mineral fuels and oils (HS code 27): 26.07% ($4.87 billion) 
  • Nuclear reactors and machinery (HS code 84): 6.91% ($1.29 billion) 
  • Cereals (HS code 10): 6.85% ($1.28 billion)
  • Animal or vegetable fats and oils (HS code 15): 5.12% ($958.07 million) 
  • Electrical machinery and equipment (HS code 85): 4.84% ($906.17 million) 
  • Vehicles (HS code 87): 4.7% ($879.48 million) 
  • Iron and steel (HS code 72): 4.54% ($848.49 million) 
  • Plastics and articles thereof (HS code 39): 4.32% ($807.85 million) 
  • Pharmaceutical products (HS code 30): 3.29% ($616.25 million)
  • Fertilizers (HS code 31): 2.43% ($453.92 million)
  • Partners

    Top 10 Import Partners of Kenya

    When it comes to import partners, Kenya engages in trade with a multitude of countries. This strategic partnership with diverse nations allows Kenya to access a wide range of quality imports, contributing to the country's economic progress and stability. Kenya’s top 10 import partners in 2023 include:

    Value In Percentage(%)

  • China: 17.5% (3.28 billion US$)
  • United Arab Emirates: 15.8% (2.95 billion US$)
  • India: 10.3% (1.92 billion US$)
  • Saudi Arabia: 5.6% (1.04 billion US$)
  • Malaysia: 4.6% (865.23 million US$)
  • USA: 4.3% (812.27 million US$)
  • Japan: 3.7% (699.90 million US$)
  • Russia: 3.2% (594.08 million US$)
  • South Africa: 2.9% (551.72 million US$)
  • Egypt: 1.9% (355.75 million US$)
  • Sample Data

    Understanding Kenya's Import Data

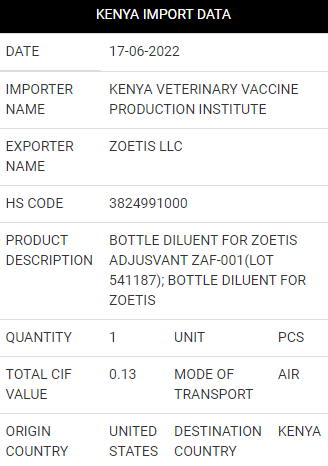
    We obtain trustworthy data from organizations, shipping businesses, and customs ports. This Trade Data contains a wide range of fields, such as HS codes, product descriptions, prices, quantities, origin country, destination country, and port names together with currency values. For traders and marketers, this trade data is crucial information that helps them to make informed decisions. From the HS codes and product descriptions to the quantity and cost of each product, everything can be obtained through this trade data. We have included a sample of this trade data for your convenience and greater understanding so that you can see what the trade data looks like as a whole, with complete details.
    Kenya's import data provides valuable information on the country's total imports, import partners, import values, and imported products. It is collected by trustworthy sources such as the Kenya National Bureau of Statistics (KNBS) and the Kenya Revenue Authority (KRA). Let's explore the key insights and trends derived from Kenya's import data in 2023. The year 2023 witnessed remarkable growth in Kenya's total imports. According to the latest import data, the country recorded a significant increase in the value of imported goods. This surge can be attributed to various factors, including increased consumer demand, expanding industries, and the government's efforts to promote trade. According to Kenya's customs data, Kenya imported goods worth a total of $18.6 billion in 2023. We offer you really helpful and informative Kenya import data and shipment data information. All of the information in our database is derived from recently updated shipping bills, invoices, and other crucial transaction documents. We obtain trustworthy data from Kenyan customs ports, organizations, and other shipping firms. Kenyan custom import data includes a wide range of fields, such as HS codes, product descriptions, quantity and price, port names, and currency values. So, as you can see, we obtain trustworthy data from organizations, shipping businesses, and customs ports. The trade data contains a wide range of fields, such as HS codes, product descriptions, prices, quantities, origin country, importers/exporters names and addresses, destination country, and port names together with currency values. For traders and marketers, this trade data is crucial information that helps them make informed decisions. From the HS codes and product descriptions to the quantity and cost of each product, everything can be obtained through this trade data. We have included a sample of the trade data for your convenience and greater understanding so that you can see what the trade data looks like as a whole, with complete details.

    Benefits

    Benefits of Kenya Import Data

  • Grow your business into the Kenyan Market.
  • View Kenya's most recent product demand.
  • Track and Examine the Shipment History of Your Rivals.
  • Give your marketing plan an approach based on import data.
  • Create a powerful brand identity in Kenya.
  • Create more ROI and future business goals.
  • You’ll receive the name and address of the importer/exporter in our reports.
  • Frequently Asked Questions!!

    Kenya import data refers to the information about the goods and services that are brought into the country from other countries.

    Kenya's import data is important because it provides insights into the country's trade patterns, economic growth, and consumption patterns. It also helps in making informed decisions for businesses and government policies.

    Kenya import data is collected by the Kenya National Bureau of Statistics (KNBS) through customs declarations and trade documents submitted by importers.

    Kenya's top import partners include China, India, the United Arab Emirates, South Africa, and Saudi Arabia.

    Kenya's main imports include mineral fuels and oils, machinery, petroleum products, iron and steel, vehicles, and pharmaceutical products.

    You might be interested in other continents as well