US export Statistics

US Export Data

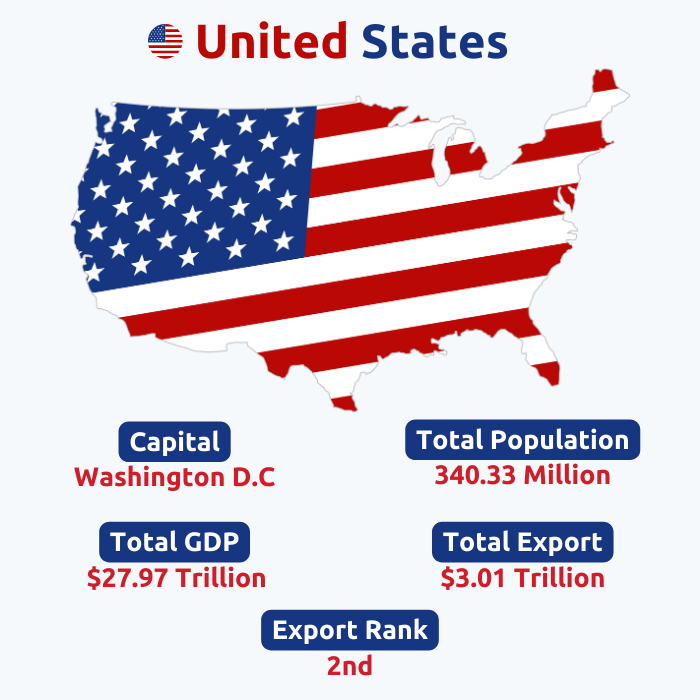
While the USA, or the United States of America, is a multinational nation, a significant portion of its territory is located in North America. 50 states plus one federal district make up the nation. Given its status as the most developed country globally, the USA is undoubtedly a powerhouse. Based on land area, the United States ranks second largest country in North America. With a total land area of about 9,831,510 km^2, the United States maintains its 4th place ranking in the world rankings. According to the US trade Statistics and US trade data, the US is the 2nd biggest exporter of goods worldwide. 

According to the US export data, the US exported a total of $2.01 trillion in 2023, with a 2% decline from the previous year. Despite being the second-largest exporter in the world, the USA's GDP export share is barely 11.77% of its exports. The total GDP of the USA is $27.36 trillion. The USA is also a part of major trading blocs in the world such as the WTO, NAFTA, and free trade agreements, based on the US trade activities. Mineral fuels and oils ($323.17 billion) are the biggest US exports in 2023. Canada ($352.84 billion) is the largest US export partner in 2023. US shipment data provides invaluable insights into the economy and direction of the United States trade relations with the rest of the world. Let us delve into key aspects of US export data, including its significance, sources, and implications for 2023.

 US Export data by HS Code, Company, Country | US Bill of Lading database

2

The country has been ranked 2nd in global exports, showing a significant position in the international trade and export landscape.

8.7%

With a mere 8.7% share in global export trade, it becomes evident that its presence in the international export market is fairly on the rise.

CANADA

Canada holds a significant role as the largest export partner of the country in terms of goods exports and export share.

MINERAL FUELS AND OILS

Mineral fuels and oils are the major and biggest export commodities of the country, playing a vital role in its economy.

Search live US Customs export data

Please select a country or provide either a description or HS Code.
export

Top 10 Exports of the US | US Export Data by HS Code

The United States, being a global economic powerhouse, boasts an impressive array of top exports and export partners. Its top 10 exports consistently make their mark in international trade and contribute significantly to the country's export revenue. The top 10 exports of the US according to the US export data and US trade data for 2023 are:

  • Mineral fuels and mineral oils (HS code 27): 16.01% ($323.17 billion)
  • Nuclear reactors, machinery, and mechanical appliances (HS code 84): 11.54% ($233 billion)
  • Electrical machinery and equipment (HS code 85): 9.94% ($200.65 billion)
  • Vehicles (HS code 87): 7.57% ($152.82 billion)
  • Aircraft, spacecraft, and parts thereof (HS code 88): 6.19% ($124.90 billion)
  • Optical, measuring, medical, or surgical instruments (HS code 90): 5.21% ($105.10 billion)
  • Pharmaceutical products (HS code 30): 4.47% ($90.30 billion)
  • Plastics and articles thereof (HS code 39): 3.85% ($77.79 billion)
  • Natural or cultured pearls, precious stones, and metals (HS code 71): 3.8% ($76.67 billion)
  • Commodities not elsewhere specified (HS code 99): 3.34% ($67.35 billion)
  • Partners

    Top 10 Export Partners of the US | US Export Data by Country

    When it comes to the United States' top 10 export partners, its most significant trading relationships are with Canada, Mexico, China, Japan, and Germany. These countries serve as vital partners in the exchange of goods and contribute to the United States' robust export sector. According to the US trade data and US shipment data, the top 10 export partners of the US in 2023 include:

    Value In Percentage(%)

  • Canada: 17.5% (352.84 billion US$)
  • Mexico: 16% (323.22 billion US$)
  • China: 7.3% (147.80 billion US$)
  • Netherlands: 4.1% (82.18 billion US$)
  • Germany: 3.8% (76.69 billion US$)
  • Japan: 3.8% (76.16 billion US$)
  • United Kingdom: 3.7% (74.08 billion US$)
  • South Korea: 3.2% (64.83 billion US$)
  • France: 2.2% (45.25 billion US$)
  • Brazil: 2.2% (44.80 billion US$)
  • Sample Data

    What is US Export Data and Why is it Important?

    We obtain trustworthy data from organizations, shipping businesses, and customs ports. This Trade Data contains a wide range of fields, such as HS codes, product descriptions, prices, quantities, origin country, destination country, and port names together with currency values. For traders and marketers, this trade data is crucial information that helps them to make informed decisions. From the HS codes and product descriptions to the quantity and cost of each product, everything can be obtained through this trade data. We have included a sample of this trade data for your convenience and greater understanding so that you can see what the trade data looks like as a whole, with complete details.

    US export data refers to detailed information on the goods and services that the United States sells to other countries. It captures various aspects such as the type of commodity, HS code, destination country, quantity, and mode of transportation. This data plays a pivotal role in monitoring and analyzing international trade flows, supporting policymaking, and aiding business decisions. Understanding US export data is of paramount importance for several reasons. Firstly, it helps identify emerging markets and sectors that offer export opportunities for US businesses. Secondly, US shipment data sheds light on the competitiveness of American industries in the global market. By examining the export performance of different sectors, policymakers can identify areas of strength and weakness, allowing them to implement targeted policies to enhance competitiveness and foster economic growth. According to the US B/L data report on exports, the US exported $2.01 trillion in 2023. So, as you can see, we obtain trustworthy data from organizations, shipping businesses, government authorities, and ports. The US trade data contains a wide range of fields, such as HS codes, product descriptions, quantities, origin country, importers/exporters names and addresses, destination country, and port names. For traders and marketers, this trade data is crucial information that helps them make informed decisions. From the HS codes and product descriptions to the quantity and cost of each product, everything can be obtained through this trade data. We have included a sample of the trade data for your convenience and greater understanding so that you can see what the trade data looks like as a whole, with complete details.

    US Export Data
    Uuid 911813234064175114 DATE 2024-04-19
    ORIGIN COUNTRY UNITED STATES DESTINATION COUNTRY QATAR
    LOADING PORT PHILADELPHIA REGIONAL PORT AUTHORITY PHILADELPHIA PENNSYLVANIA UNLOADING PORT HAMAD WA QATAR
    EXPORTER US EXPORTER ADDRESS
    HS CODE 000000 PRODUCT DESCRIPTION CLOROX HOUSEHOLDCLEANINGPRODUCTSHS:000000000 (HARMONIZED CODE: 340250)OR SOFTWARE WERE EXPORTED FROMWITH THE EXPORT ADMINISTRATIONTO U.S. LAW PROHIBITED. UN3085, OXIDIZING SOLID,CORROSIVE, N.O.S.(1-BROMO-3-CHLORO-5,5-DIMETHYL-2,4-IMIDAZOLIDINEDIONE, 1,3-DICHLORO-5,5-DIMETHYLHYDANTOIN) CLASS5.1(8), PG II, LTD QTYHS:3402505100 (HARMONIZED CODE: 340250)( 140 FIBREBOARD BOXES-4G - 167.650 KGS. )SUBSTANCENAME(PROPER SHIPPING NAME): OXIDIZINGSOLID, CORROSIVE, N.O.S.*1-BROMO-3-CHLORO-5,5-DIMETHYL-2,4-IMIDAZOLIDINEDIONE,1,3-DICHLORO-5,5-DIMETHYLHYDANTOIN CLASS: 5.1 LABEL/SUBRISK: OXIDIZER,CORROSIVE/8 UN#: UN3085 PACKAGING GROUP: IIEMERGENCY PHONE: 17035273887 CLOROX HOUSEHOLDCLEANINGPRODUCTSHS:3808945095FMC#001162NFCHB 4455ALL CHARGES PREPAID (HARMONIZED CODE: 380894)OR SOFTWARE WERE EXPORTED FROMWITH THE EXPORT ADMINISTRATIONTO U.S. LAW PROHIBITED.
    QUANTITY 5014 UNIT BOX(ES)
    NET WEIGHT 30511.5 WEIGHT UNIT Kg
    MASTER BILL OF LADDING MEDUVD664227 TRANSPORT TYPE SEA
    CARRIER NAME MEDITERRANEAN SHIPPING COMPANY VESSEL NAME KLEVEN
    CONTAINER NO MEDU4487918,BEAU5940134 TEU 4
    SCAC CODE MSCU VOYAGE UA415A
    Benefits

    Benefits of the US Export data

  • Researchers, analysts, and economists can evaluate the state and performance of the US economy with the use of export statistics.
  • Produce sincere leads from the US export industry.
  • Find out what the most recent US product demand is.
  • Keep an eye on your rivals and surpass them.
  • Make your marketing plan based on export data.
  • Frequently Asked Questions!!

    According to the US trade statistics, the total value of the US exports in 2023 was $2.01 trillion.

    US export data is important as it helps identify emerging markets, analyze export performance, and make informed business decisions.

    According to the US-China trade data and trade statistics, the top 10 US exports to China in 2023 are:

    1. Mineral fuels and oils: $19.73 billion

    2. Oil seeds and oleaginous fruits: $15.85 billion

    3. Nuclear reactors and machinery: $13.72 billion

    4. Electrical machinery and equipment: $11.64 billion

    5. Optical, medical, or surgical instruments: $11.30 billion

    6. Pharmaceutical products: $9.89 billion

    7. Vehicles: $8.13 billion

    8. Plastics and articles thereof: $7.44 billion

    9. Aircraft, spacecraft, and parts thereof: $6.81 billion

    10. Organic chemicals: $4.20 billion 

    According to the US trade records, mineral fuels and oils, nuclear reactors and machinery, and electrical machinery and equipment are the top 3 exports of the US in 2023.

    Canada was the largest export partner of the US in 2023 according to the US trade activities.

    You might be interested in other continents as well