Overview

Oceania Trade Data

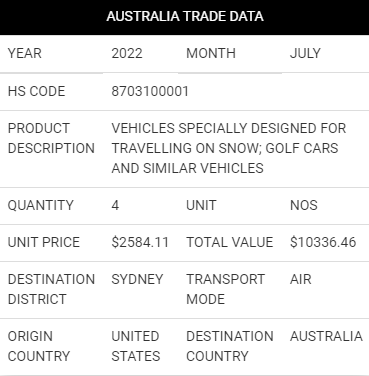
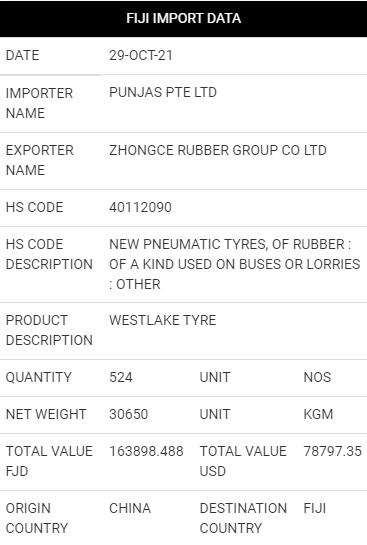
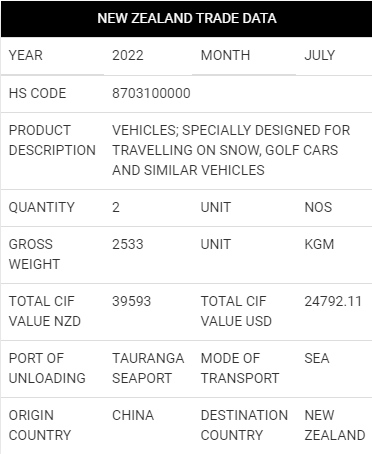
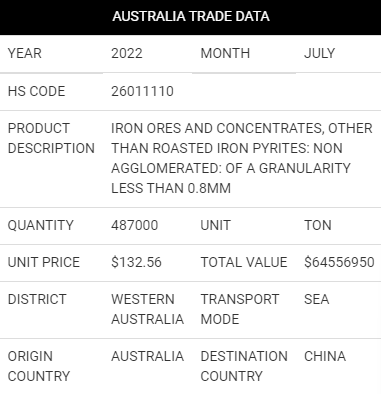
The smallest continent on earth, Oceania, is home to 14 sovereign and acknowledged nations, including Fiji, New Zealand, and Australia. Businesses and individuals eager to increase their profits through international trade, focusing on Oceania countries, can greatly benefit from the original and reliable Oceania customs data, statistical data, and B/L data that TradeImeX offers for several Oceania countries. Our Oceania trade data can be used to obtain information regarding invoices, customs reports, B/Ls, and shipment bills. Depending on the kind of product or service, we may provide highly tailored and unique Oceania trade databases for any country's customers, based on our expertise and experience. Get access to Oceania shipment data and Oceania’s import-export market trends with our user-friendly trade database.

 Oceania Trade Data | Oceania Import Export Data
# code...

Countries Covered Under Oceania Trade Data

  Customs Data

  Statistical/BL Data

Imports

Trade Balance of Goods in the Oceania Countries as per Customs Stats

When examining the trade landscape of Oceania, it becomes evident that certain goods and trade partners dominate the region. Oceania’s total trade balance in 2023 is $69.37 billion. Oceania's top 10 goods encompass a diverse range of commodities, demonstrating the region's economic diversity. The total trade balance of Oceania’s top 10 goods in 2023, according to Oceania trade data and Oceania shipment data are:

  • Ores, slag, and ash : $105.85 billion
  • Mineral fuels and oils : $80.32 billion
  • Meat and edible meat offal : $16.62 billion
  • Precious stones and metals, pearls : $15.11 billion
  • Dairy products : $12.63 billion
  • Salt, sulfur, lime, and cement : $12.56 billion
  • Cereals : $12.10 billion
  • Oil seeds and oleaginous fruits : $4.17 billion
  • Inorganic chemicals : $3.88 billion
  • Copper and articles thereof : $3.31 billion
  • Partners

    Top 10 Trade Partners of Oceania

    Additionally, Oceania's trade partners play a crucial role in shaping the Oceania trade activities. Among the top 10 trade partners, countries like China, Japan, and the United States feature prominently, reflecting the fluid global trade connections that Oceania maintains. Oceania’s top 10 trade partners in 2023, according to Oceania trade records and Oceania shipment data include:

  • China: Exports ($138.95 billion), Imports ($85.74 billion)
  • Japan: Exports ($42.13 billion), Imports ($22.37 billion)
  • South Korea: Exports ($23.17 billion), Imports ($27.60 billion)
  • USA: Exports ($18.82 billion), Imports ($36.28 billion)
  • India: Exports ($15.16 billion), Imports ($6.85 billion)
  • Taiwan: Exports ($12.02 billion), Imports ($7.01 billion)
  • New Zealand: Exports ($8.51 billion), Imports ($6.02 billion)
  • Indonesia: Exports ($8.47 billion), Imports ($4.74 billion)
  • Vietnam: Exports ($8.27 billion), Imports ($7.33 billion)
  • Singapore: Exports ($8.16 billion), Imports ($20.48 billion)
  • Sample Data

    What is Oceania Trade Data?

    Oceania trade data refers to the information and statistics related to the import and export activities of these nations. It encompasses valuable details such as trade volume, trade partners, products traded, and emerging trends. This comprehensive Oceania shipment data set enables businesses to analyze market opportunities, make informed decisions, and develop effective strategies for international trade. Businesses can harness the power of Oceania trade data to gain a competitive edge and drive success in the region. Oceania trade data serves as a critical resource for businesses aiming to tap into the region's market potential. With a rising middle class and increasing disposable income, countries in Oceania offer lucrative market opportunities across various sectors. Our Oceania trade data or Oceania trade statistics can be used to obtain information regarding invoices, B/Ls, and shipment bills. Our expertise lies in creating highly tailored and individualized databases that include HS codes, product descriptions, importer-exporter names, and additional information. According to Oceania export data, Oceania exported goods worth $430.72 billion in 2023, while Oceania’s imports totaled $361.35 billion, based on Oceania import data. At present, Oceania holds nearly 8% of the stake in world trade. According to Oceania Trade Data, Australia accounts for the majority of supplies (exports) to Oceania. Mineral fuels, ores, and precious metals are the top three exports from Oceania. According to Oceania Trade reports, the most popular imports into Oceania are mineral fuels, vehicles, and machinery.

    Are you ready to skyrocket your profits? Contact us.