US import Statistics

USA Import Data

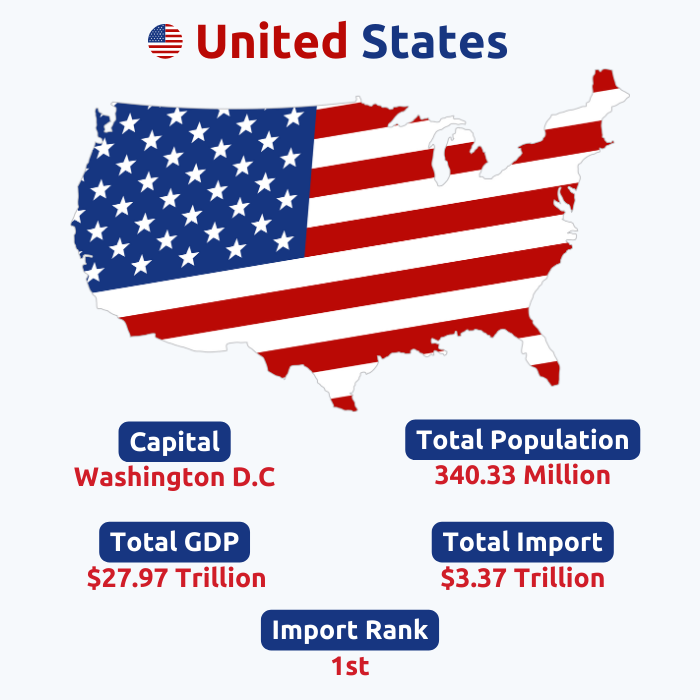
North America contains a sizable portion of the United States of America, commonly known as the USA, despite being a global nation. 50 states plus one federal district make up the nation. Given its status as the most developed country globally, the USA is undoubtedly a powerhouse. Canada, Mexico, and the Bahamas are all neighbors of the nation. The US is the second largest importer of goods in the world. Every year, countless businesses around the world engage in cross-border trade, with the United States being one of the most sought-after markets. To stay ahead of the game in the market, businesses need access to timely and accurate data that can provide valuable insights into the US import landscape. According to the US trade statistics and US trade data, the US is ranked as the number one importer of goods in the world.

According to the US import data, the US imports had a total value of around $3.2 trillion in 2023 with a decrease of 6% as compared to the previous year. The US is also part of several trading blocs such as NAFTA, WTO, and many free trade agreements. Electrical machinery and equipment ($463.36 billion) are the leading US imports. Mexico ($480.08 billion) is the top import partner of the US. The current total GDP of the USA is $27.36 trillion. US imports have a total GDP share of 15.59%. This is where US import data comes into play. Let us explore the importance of US shipment data, its impact on businesses, and how it can be leveraged in 2023.
 US Import Data By HS Code, Company, Product, US Importers Database Directory List

1

The country has been ranked 1st in global imports, showing a significant position in the international trade landscape and import market.

13.5%

With a mere 13.5% share in global import trade, it becomes evident that its presence in the international import market is fairly on the rise.

MEXICO

Mexico holds a significant role as the largest import partner of the country in terms of goods imports and import share.

ELECTRICAL MACHINERY AND EQUIPMENT

Electrical machinery and equipment are the biggest import commodities of the country, playing a vital role in its economy.

Search live US Customs import data

Please select a country or provide either a description or HS Code.
import

Top 10 imports of the US | US Import Data by HS Code

The United States economy thrives on global trade, with imports playing a crucial role in the nation's thriving commercial landscape. When it comes to imports, the US has a diverse range of products flowing in from various countries. The top 10 imports of the US according to the US shipment data and US import data by product and HS Code in 2023 are:

  • Electrical machinery and equipment (HS code 85): 14.61% ($463.36 billion)
  • Nuclear reactors and machinery (HS code 84): 14.47% ($459.19 billion)
  • Vehicles (HS code 87): 12.01% ($381.03 billion)
  • Mineral fuels and mineral oils (HS code 27): 8.4% ($266.59 billion)
  • Pharmaceutical products (HS code 30): 5.61% ($177.84 billion)
  • Commodities not elsewhere specified (HS code 99): 3.94% ($124.97 billion)
  • Optical, measuring, medical, or surgical instruments (HS code 90): 3.73% ($118.32 billion)
  • Precious stones and metals (HS code 71): 2.82% ($89.54 billion)
  • Plastics and articles thereof (HS code 39): 2.28% ($72.34 billion)
  • Furniture; bedding, and mattresses (HS code 94): 2.18% ($69.00 billion)
  • Partners

    Top 10 Import Partners of the US | US Import Data by Country

    As for import partners, the US collaborates with several countries to facilitate this robust import system. The top 10 import partners of the US include Mexico, China, Canada, Japan, and Germany, among others. These countries forge strong trade alliances. According to the import data, the top 10 import partners of the US in 2023 according to the US trade data and US import data include:

    Value In Percentage(%)

  • Mexico: 15.1% (480.08 billion US$)
  • China: 14.1% (448.03 billion US$)
  • Canada: 13.6% (431.19 billion US$)
  • Germany: 5.1% (163.08 billion US$)
  • Japan: 4.8% (151.58 billion US$)
  • South Korea: 3.8% (119.72 billion US$)
  • Vietnam: 3.7% (118.94 billion US$)
  • Taiwan: 2.8% (89.91 billion US$)
  • India: 2.8% (87.28 billion US$)
  • Ireland: 2.6% (82.71 billion US$)
  • Sample Data

    What is US Import Data under the B/L Reports?

    We obtain trustworthy data from organizations, shipping businesses, and customs ports. This Trade Data contains a wide range of fields, such as HS codes, product descriptions, prices, quantities, origin country, destination country, and port names together with currency values. For traders and marketers, this trade data is crucial information that helps them to make informed decisions. From the HS codes and product descriptions to the quantity and cost of each product, everything can be obtained through this trade data. We have included a sample of this trade data for your convenience and greater understanding so that you can see what the trade data looks like as a whole, with complete details.

    US import data refers to detailed information regarding goods imported into the United States. It encompasses a wide range of data including product descriptions, quantities, importers' and exporters' details, shipping ports, and much more. This wealth of data is compiled and organized by various government agencies, such as the US Customs and Border Protection, and is made available to the public for analysis and research purposes. According to the US import data for 2023 in the B/L database, the US imported goods worth $3.2 trillion. The US's approved ports, organizations, and other shipping firms provide accurate information. HS codes and product descriptions are among the many fields that are included in the US trade data. So, as you can see, we obtain trustworthy data from organizations, government authorities, shipping businesses, and shipping manifests. The trade data contains a wide range of fields, such as HS codes, product descriptions, quantities, origin country, importers/exporters names and addresses, destination country, and port names. For traders and marketers, this trade data is crucial information that helps them make informed decisions. From the HS codes and product descriptions to the quantity and cost of each product, everything can be obtained through this trade data. We have included a sample of the trade data for your convenience and greater understanding so that you can see what the trade data looks like as a whole, with complete details.

    US Import Data
    ID 1399434 DATE 2024-06-14
    BILL TYPE MASTER BILL MASTER BILL OF LADDING NUMBER MEDUGW651871
    BILL OF LADDING NUMBER IMPORTER DE WELL CONTAINER SHIPPING INC
    US IMPORTER ADDRESS . UNIT A 5553 BANDINI BLVD BELL CA 90201 UNITED STATES FOREIGN EXPORTER NAME DE WELL CONTAINER SHIPPING INC
    FORIEGN EXPORTER ADDRESS . 718 GUANGMING RD RM 808 PUDONG SHANGHAI 31 200000 CHINA NOTIFY PARTY NAME DE WELL CONTAINER SHIPPING INC
    NOTIFY PARTY ADDRESS . UNIT A 5553 BANDINI BLVD BELL CA 90201 UNITED STATES HS CODE 000415
    PRODUCT DESCRIPTION BRAKE ROTORS SCAC CODE:DWCH AMS FILING PARTY BY SHIPPER HB/L:SWUHS0004158 QUANTITY 84
    UNIT PKG NET WEIGHT 77880
    WEIGHT UNIT KG TEU 4
    LOADING PORT COLON PANAMA CANAL CARIBBEAN UNLOADING PORT NEW YORK NEWARK AREA NEWARK NEW JERSEY
    ORIGIN COUNTRY PANAMA SHIPPING COUNTRY LIBERIA
    DESTINATION COUNTRY UNITED STATES TRANSPORT TYPE SEA CONTAINERIZED
    CARRIER NAME MEDU VESSEL NAME MSC FATMA
    CONTAINER NUMBER MEDU1092658,FCIU4349048,CAIU2272592,MSDU1001531 MEASUREMENT 100 CUBIC METERS
    VOYAGE 415N CONVEYANCE IMO NUMBER/LLOYDS NUMBER: 9927251
    Benefits

    Benefits of the US Import data

  • Businesses aiming to grow their operations or boost income can benefit from the US import data.
  • The import data from the US is also important for companies trying to find new markets for their goods.
  • Make your marketing plan based on data.
  • Create a powerful brand identity in the US import market.
  • Identify long-term objectives for your company and increase ROI.
  • Frequently Asked Questions!!

    US import data refers to detailed information regarding goods imported into the United States.

    Various government agencies, such as the US Customs and Border Protection compile and organize the US import data.

    According to the US-China trade data and trade statistics, the top 10 imports by the US from China in 2023 are: 

    1. Electrical machinery and equipment: $126.67 billion

    2. Nuclear reactors and machinery: $85.88 billion

    3. Toys, games, and sports requisites: $33.38 billion

    4. Furniture, bedding, and mattresses: $20.28 billion

    5. Plastics and articles thereof: $20.15 billion

    6. Vehicles: $16.41 billion

    7. Optical, medical, or surgical instruments: $11.79 billion

    8. Articles of iron or steel: $11.71 billion

    9. Footwear: $10.03 billion

    10. Articles of apparel and clothing, knitted or crocheted: $9.99 billion 

    According to the US trade records, the total value of US imports in 2023 was $3.2 trillion.

    Mexico, China, and Canada are the top 3 import partners of the US in 2023, based on the US trade activities.

    You might be interested in other continents as well