Quarterly Analysis Of Indonesia’s Trade Data – TradeRollercoaster
Indonesia is considered home to a large variety of natural resources that are found deep under the Earth. The primary industries here are crude oil, cotton, natural gas, tourism, and fishing.

SYNOPSIS
Indonesia, also known as “The Republic of Indonesia” is an island nation and is situated in the Southeastern part of Asia and Oceania. This nation is considered the world’s biggest Archipelagic country and the 14th biggest in terms of land area. Indonesia shares its territorial and maritime boundaries with multiple nations such as New Guinea, Malaysia, Singapore, Vietnam, India, etc. The country is dominated by private and government sectors and is the only Southeast Asian nation that is a part of G20.
Indonesia is considered home to a large variety of natural resources that are found deep under the Earth. The primary industries here are crude oil, cotton, natural gas, tourism, and fishing. From the beginning, the primary export products from Indonesia are palm oil and coal briquettes whereas, the major imports to the nation are crude oil, telephones, automobiles, and wheat.
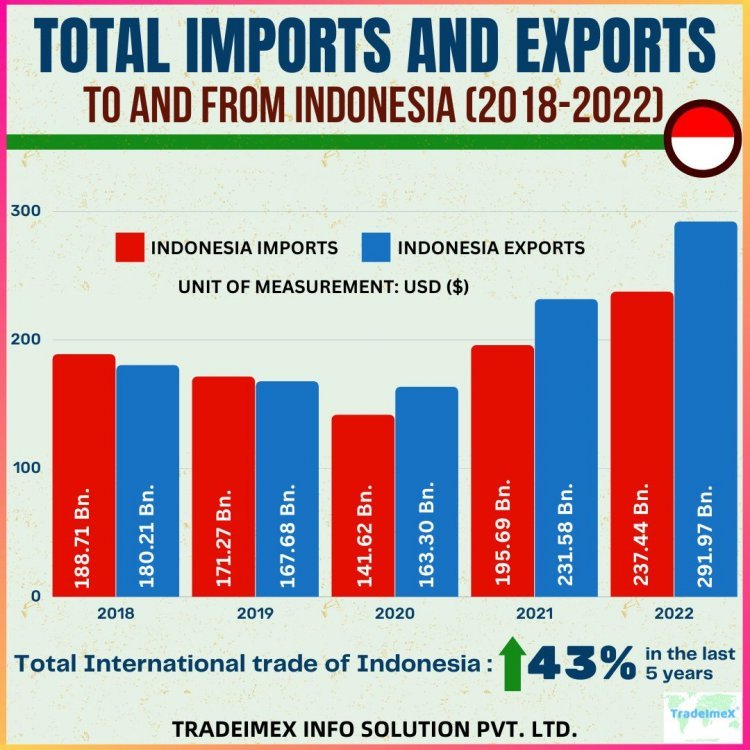
Talking about the annual trade patterns of Indonesia, then as per the Indonesia Customs Data report, the past 5-year trend is as follows:
|
TOTAL IMPORTS AND EXPORTS TO AND FROM INDONESIA (2018-2022) |
|||
|
YEAR |
IMPORTS |
EXPORTS |
TOTAL TRADE |
|
2018 |
USD 188.71 billion |
USD 180.21 billion |
USD 368.92 billion |
|
2019 |
USD 171.27 billion |
USD 167.68 billion |
USD 338.95 billion |
|
2020 |
USD 141.62 billion |
USD 163.30 billion |
USD 304.92 billion |
|
2021 |
USD 195.69 billion |
USD 231.58 billion |
USD 427.27 billion |
|
2022 |
USD 237.44 billion |
USD 291.97 billion |
USD 527.41 billion |
The total international trade of Indonesia has gone up by 43% in the last 5 years and the nation became successful in converting its trade deficit into a surplus.
----------
QUARTER-WISE TRADE STATISTICS OF INDONESIA
In this section, we are going to a deeper level and will analyze the trade statistics of Indonesia on a quarterly basis (Q1-Q4 2022 and Q1 2023) as mentioned in Indonesia Customs Data reports.
The quarter-wise trade analysis of Indonesia is as follows:
|
QUARTER-WISE TRADE STATISTICS OF INDONESIA (USD) |
|||||
|
|
Q1 (2022) |
Q2 (2022) |
Q3 (2022) |
Q4 (2022) |
Q1 (2023) |
|
IMPORTS |
56.81 Bn. |
59.37 Bn. |
63.30 Bn. |
57.96 Bn. |
54.95 Bn. |
|
EXPORTS |
66.14 Bn. |
74.98 Bn. |
78.20 Bn. |
72.65 Bn. |
67.12 Bn. |
Now, from the table, we get to know that the value of Imports in Indonesia Import Data for Q1 (2022) was more than the value of Q1 (2023) by 3.27%. On the other hand, it is also observed that the value of Indonesia Export Data went up in Q1 (2023) from Q1 (2022) by 1.5%. Hence, it is concluded that Indonesia managed to cut down its imports and expanded exports which reduced the trade gap in Q1 of the year 2023. The trade surplus in Q1 (2022) was USD 9.33 billion but in Q1 (2023), this trade surplus grew and reached USD 12.17 billion.
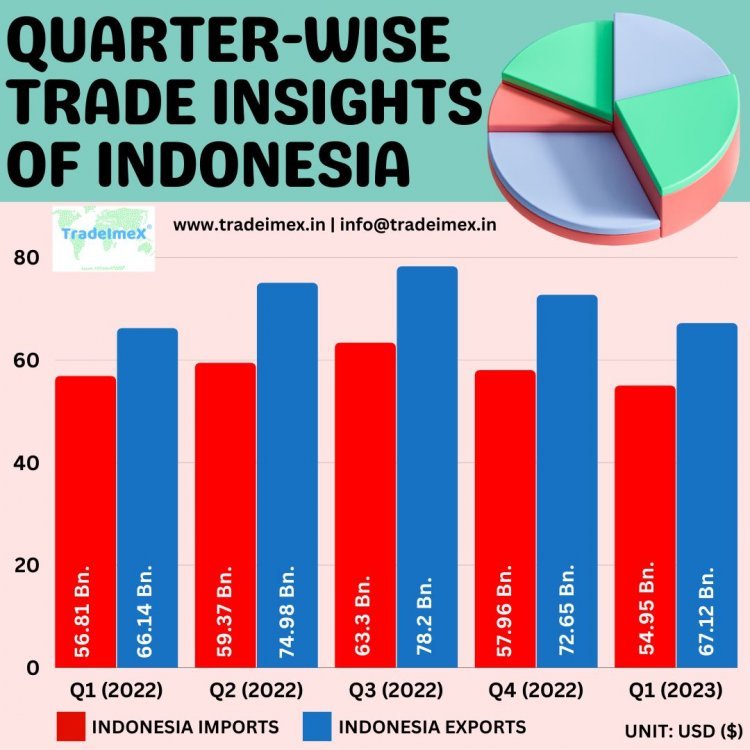
Although the performance of Indonesia got improved when we compare Q1 of both years, on comparing Q4 (2022) with Q1 (2023), the performance is seen declining, as the trade surplus in Q1 (2023) declined by USD 2.52 billion from Q4 (2022).
----------
TOP 10 EXPORT PRODUCTS OF INDONESIA
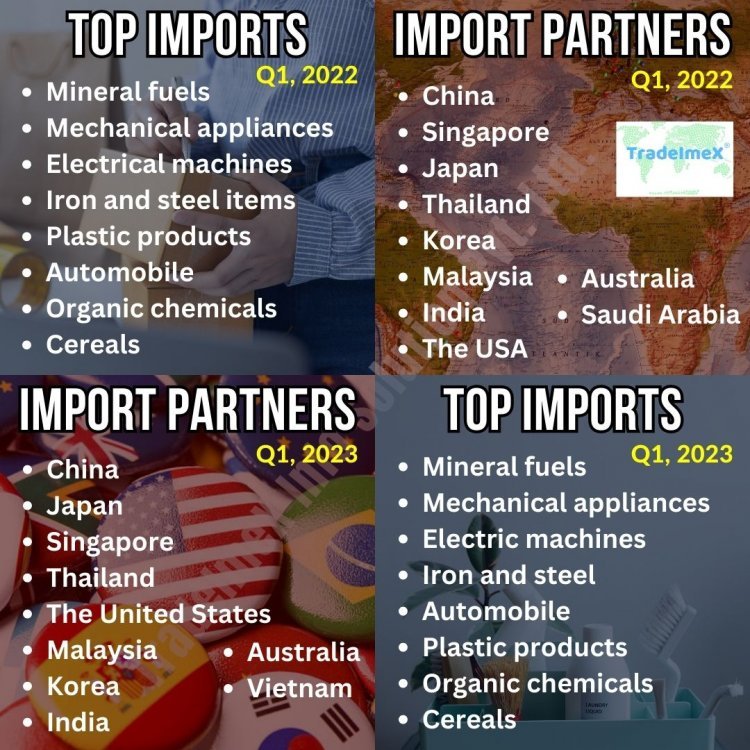
As per Indonesia Trade Data statistics for Q1 of 2022 and Q1 of 2023, the major exports from Indonesia to the world were:
QUARTER 1 (2022)
Total exports in Q1 (2022) from Indonesia were worth USD 66.14 billion. Amongst all, the top 10 exports were as follows:
- Mineral fuels and oils (USD 12.17 billion)
- Animal and vegetable oils (USD 7.91 billion)
- Iron and steel products (USD 6.65 billion)
- Electrical machines and gadgets (USD 3.3 billion)
- Natural and precious stones (USD 2.44 billion)
- Light automobile (USD 2.44 billion)
- Ores and slag (USD 2.44 billion)
- Chemical products (USD 2.18 billion)
- Footwear (USD 1.99 billion)
- Mechanical appliances like boilers and reactors (USD 1.83 billion)
QUARTER 1 (2023)
Just like the Q1 of 2022, Indonesia exported numerous goods in the Q1 of 2023 as well which were worth USD 67.12 billion. The top 10 exports from the nation amongst them were as follows:
- Mineral fuels and oil (USD 16.80 billion)
- Animal and vegetable fats (USD 7.03 billion)
- Iron and steel (USD 6.55 billion)
- Electric machines and appliances (USD 3.98 billion)
- Automobile (USD 2.85 billion)
- Natural and precious stones (USD 2.47 billion)
- Nickel products (USD 1.81 billion)
- Chemical items (USD 1.77 billion)
- Ores and slag (USD 1.65 billion)
- Footwear (USD 1.64 billion)
----------
TOP 10 EXPORT PARTNERS OF INDONESIA
Major export partners of Indonesia in this world are China, Japan, the USA, and India. The majority of Indonesian goods are shipped to these top nations. As per the Indonesia Export Data report, the top 10 major nations in this list are as follows:
|
TOP 10 EXPORT PARTNERS OF INDONESIA IN Q1 (2022) AND Q1 (2023) |
|||
|
QUARTER 1 (2022) – USD 66.14 Bn. |
QUARTER 1 (2023) – USD 67.12 Bn. |
||
|
China |
USD 13.08 billion |
China |
USD 16.57 billion |
|
The USA |
USD 7.79 billion |
Japan |
USD 6.07 billion |
|
Japan |
USD 5.60 billion |
The USA |
USD 5.83 billion |
|
India |
USD 4.53 billion |
India |
USD 4.66 billion |
|
Malaysia |
USD 3.52 billion |
Singapore |
USD 3.33 billion |
|
Singapore |
USD 3.44 billion |
Malaysia |
USD 3.32 billion |
|
Korea |
USD 3.11 billion |
The Philippines |
USD 2.94 billion |
|
The Philippines |
USD 2.53 billion |
Korea |
USD 2.85 billion |
|
Thailand |
USD 1.92 billion |
Thailand |
USD 2.02 billion |
|
Vietnam |
USD 1.73 billion |
Vietnam |
USD 1.72 billion |
----------
TOP 10 IMPORT PRODUCTS OF INDONESIA
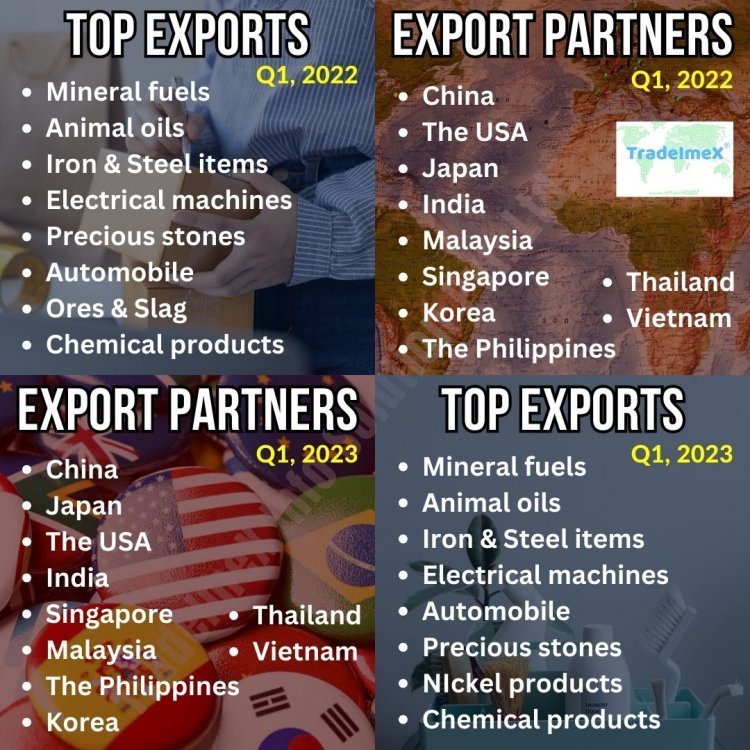
As per Indonesia Trade Data statistics for Q1 of 2022 and Q1 of 2023, the major Imports to Indonesia from the world were:
QUARTER 1 (2022)
Total imports in Q1 (2022) to Indonesia were worth USD 56.81 billion. Amongst all, the top 10 imports were as follows:
- Mineral fuels and oils (USD 9.38 billion)
- Mechanical appliances like boilers and reactors (USD 7.59 billion)
- Electrical machines and gadgets (USD 6.36 billion)
- Iron and steel products (USD 3.72 billion)
- Plastic items (USD 3.02 billion)
- Light automobile (USD 2.24 billion)
- Organic chemicals (USD 2.12 billion)
- Cereals (USD 1.17 billion)
- Sugar and confectionary items (USD 1.13 billion)
- Animal fodder (USD 982.57 million)
QUARTER 1 (2023)
Just like the Q1 of 2022, Indonesia imported numerous goods in the Q1 of 2023 as well which were worth USD 54.95 billion as mentioned in the Indonesia Import Data report. The top 10 imports to the nation amongst them were as follows:
- Mineral fuels and oil (USD 9.52 billion)
- Mechanical machines and appliances (USD 7.4 billion)
- Electric machines and appliances (USD 6.87 billion)
- Iron and steel (USD 2.95 billion)
- Automobile (USD 2.75 billion)
- Plastic articles (USD 2.32 billion)
- Organic chemicals (USD 1.75 billion)
- Cereals (USD 1.36 billion)
- Iron and steel items (USD 1.22 billion)
- Animal fodder (USD 1.05 billion)
----------
TOP 10 IMPORT PARTNERS OF INDONESIA
Major import partners of Indonesia in this world are China, Japan, Singapore, and Thailand. The majority of foreign goods are shipped from these top nations. As per the Indonesia Import Data report, the top 10 major nations in this list are as follows:
|
TOP 10 IMPORT PARTNERS OF INDONESIA IN Q1 (2022) AND Q1 (2023) |
|||
|
QUARTER 1 (2022) – USD 56.81 Bn. |
QUARTER 1 (2023) – USD 54.95 Bn. |
||
|
China |
USD 15.9 billion |
China |
USD 15.3 billion |
|
Singapore |
USD 4.57 billion |
Japan |
USD 4.29 billion |
|
Japan |
USD 4.29 billion |
Singapore |
USD 4.03 billion |
|
Thailand |
USD 3.18 billion |
Thailand |
USD 2.92 billion |
|
Korea |
USD 2.98 billion |
The USA |
USD 2.90 billion |
|
Malaysia |
USD 2.91 billion |
Malaysia |
USD 2.82 billion |
|
India |
USD 2.66 billion |
Korea |
USD 2.82 billion |
|
The USA |
USD 2.39 billion |
India |
USD 2.11 billion |
|
Australia |
USD 2.01 billion |
Australia |
USD 1.99 billion |
|
Saudi Arabia |
USD 1.30 billion |
Vietnam |
USD 1.28 billion |
----------
TRADE FORECAST OF INDONESIA TRADE DATA
Being one of the most active participants in the global trade market, Indonesia is expected to boost its trade and take its trade data to the next level within a few years. It is also forecasted that the Q1 of 2024 would decline a bit but that fall would get recovered in the following three quarters. The country would be able to maximize its exports while minimizing its imports significantly in the coming years and hence, will be successful in maintaining a greater trade surplus than in 2023.
The economy of Indonesia is the 6th largest economy in the world and due to the consistent behavior of the nation, it is estimated that the rankings of the nation would also increase and become more attractive.
----------
BONUS TIP
Any marketer or trader who is looking for the most reliable and authentic source of getting Indonesia Trade Data report should get in touch with TradeImeX. We are one of the premier companies available online that delivers Import Export Data and Global Trade Data to more than 70 nations.
We provide free samples and demos to our new customers before delivering them the final database so as to make them understand the way in which this database is read. Till now, we have assisted 5000+ clients and would be happy to see you becoming a part of our growing and happy family.
WEBSITE: https://www.tradeimex.in
EMAIL ID: info@tradeimex.in
-- END --
What's Your Reaction?


